Its been a month now since EuroPython 2024 took place and as the dust settles, we’ve gathered feedback from 157 attendees to understand what made this year’s event special, what challenges were faced, and how the experience can shape future EuroPythons. Whether you were there in person or followed along online, join us as we dive into the analysing the feedback!
The data we have represents around 13% of the onsite attendees and around 11% of total attendees. One caveat about this data is that as we didn't collect demographic data, we can't be certain that our respondents were representative of all attendees, but as you'll see we got some fascinating insights nonetheless! Also a huge thank you to everyone who took the time to fill out the feedback form - your help was greatly appreciated!
Satisfaction with the conference
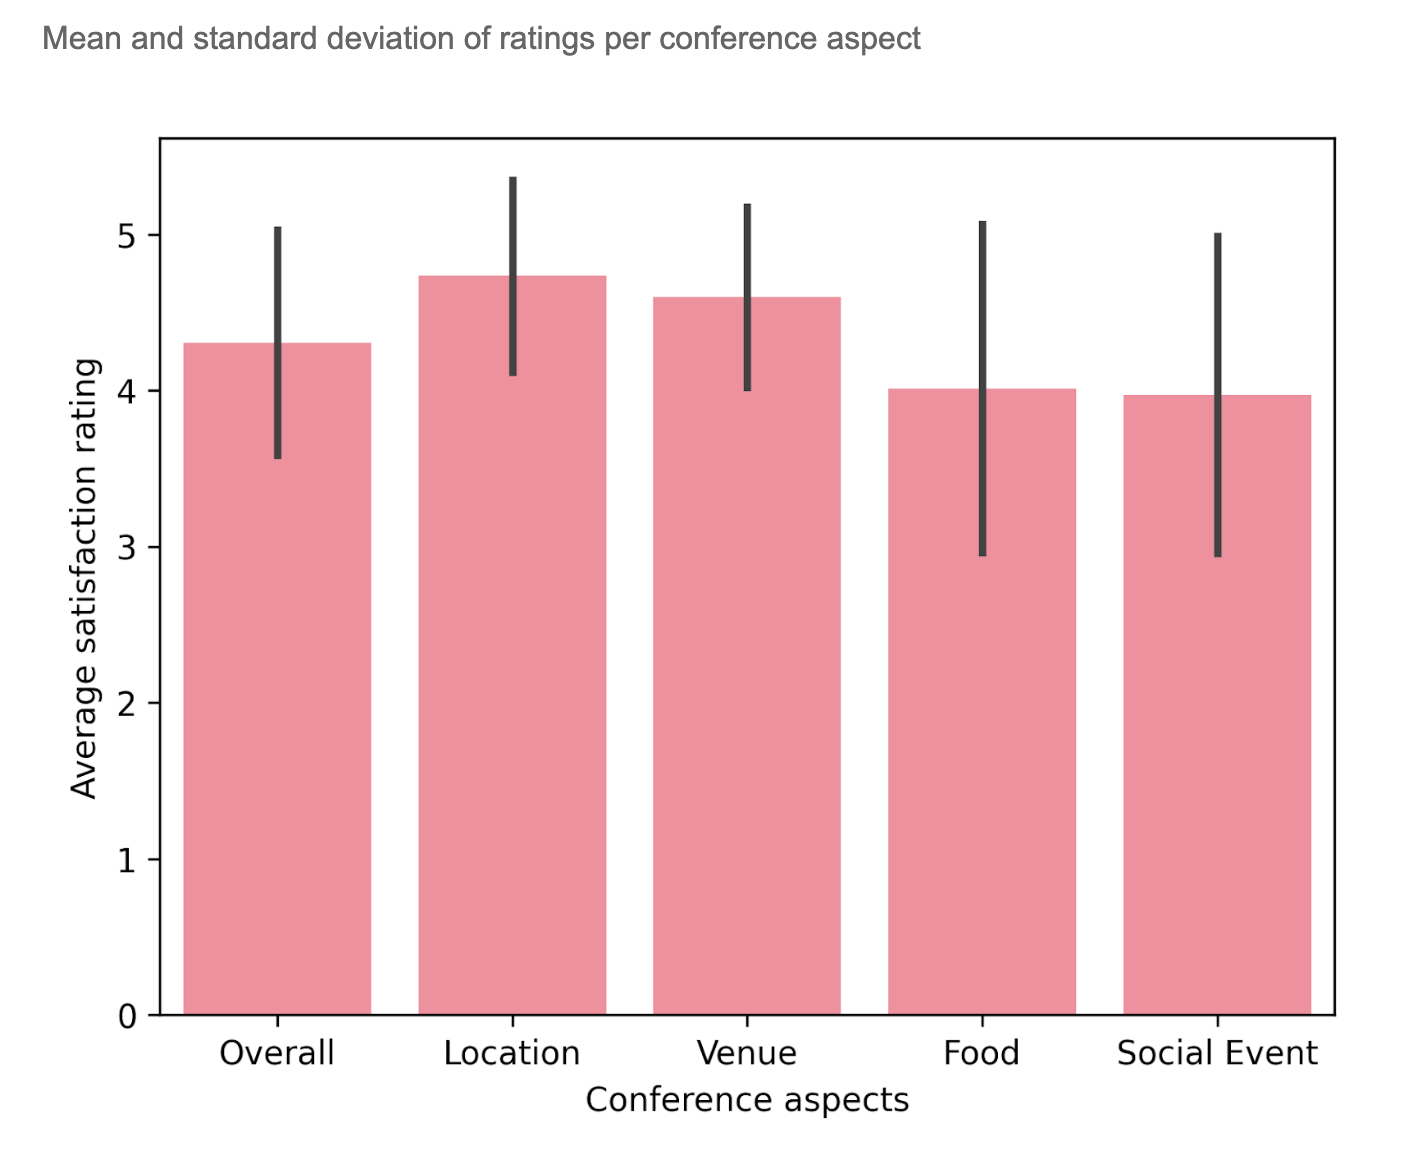
First things first: how much did people like the conference? We asked people to let us know how satisfied they were with EuroPython overall, as well as specific aspects like the venue, the location, the food and the social event.
We're delighted to say: attendees really liked the conference! The mean overall satisfaction rating was 4.3 of 5. Attendees were also satisfied with all of the aspects we asked about, with the venue (M = 4.6), food (M = 4.0) and the social event (M = 4.0) all getting high ratings. Prague as a location was a particular popular choice, getting a mean rating of 4.7!
We also had a look to see which of these aspects were most strongly related to overall satisfaction with the conference. Using a Spearman correlation, we found that satisfaction with the food (rs = 0.20) and the social event (rs = 0.17) had the highest relationship with overall satisfaction with the conference. However, any fellow stats nerds reading this might have noticed that these are not particularly strong relationships, likely meaning that other factors we didn’t explicitly measure are driving how much people liked the conference. Which leads us to ...
Things that people liked about the conference
One of our survey questions was a free text field, asking attendees to tell us what they liked about the conference. Ninety-seven people gave us (invaluable!) feedback on this question.
In order to make these easier to analyse, we used a large language model to extract the topics that each attendee was discussing in their responses. This was by no means perfect, so take it as a guide rather than something totally objective (e.g., “organisation” was pretty broadly interpreted by the model), but it does give us a general sense of what sorts of things people enjoyed about EuroPython.
The top topics (where at least 5 people had mentioned them in their feedback) are listed below.
We have also plotted these topics by their mentions for better understanding.
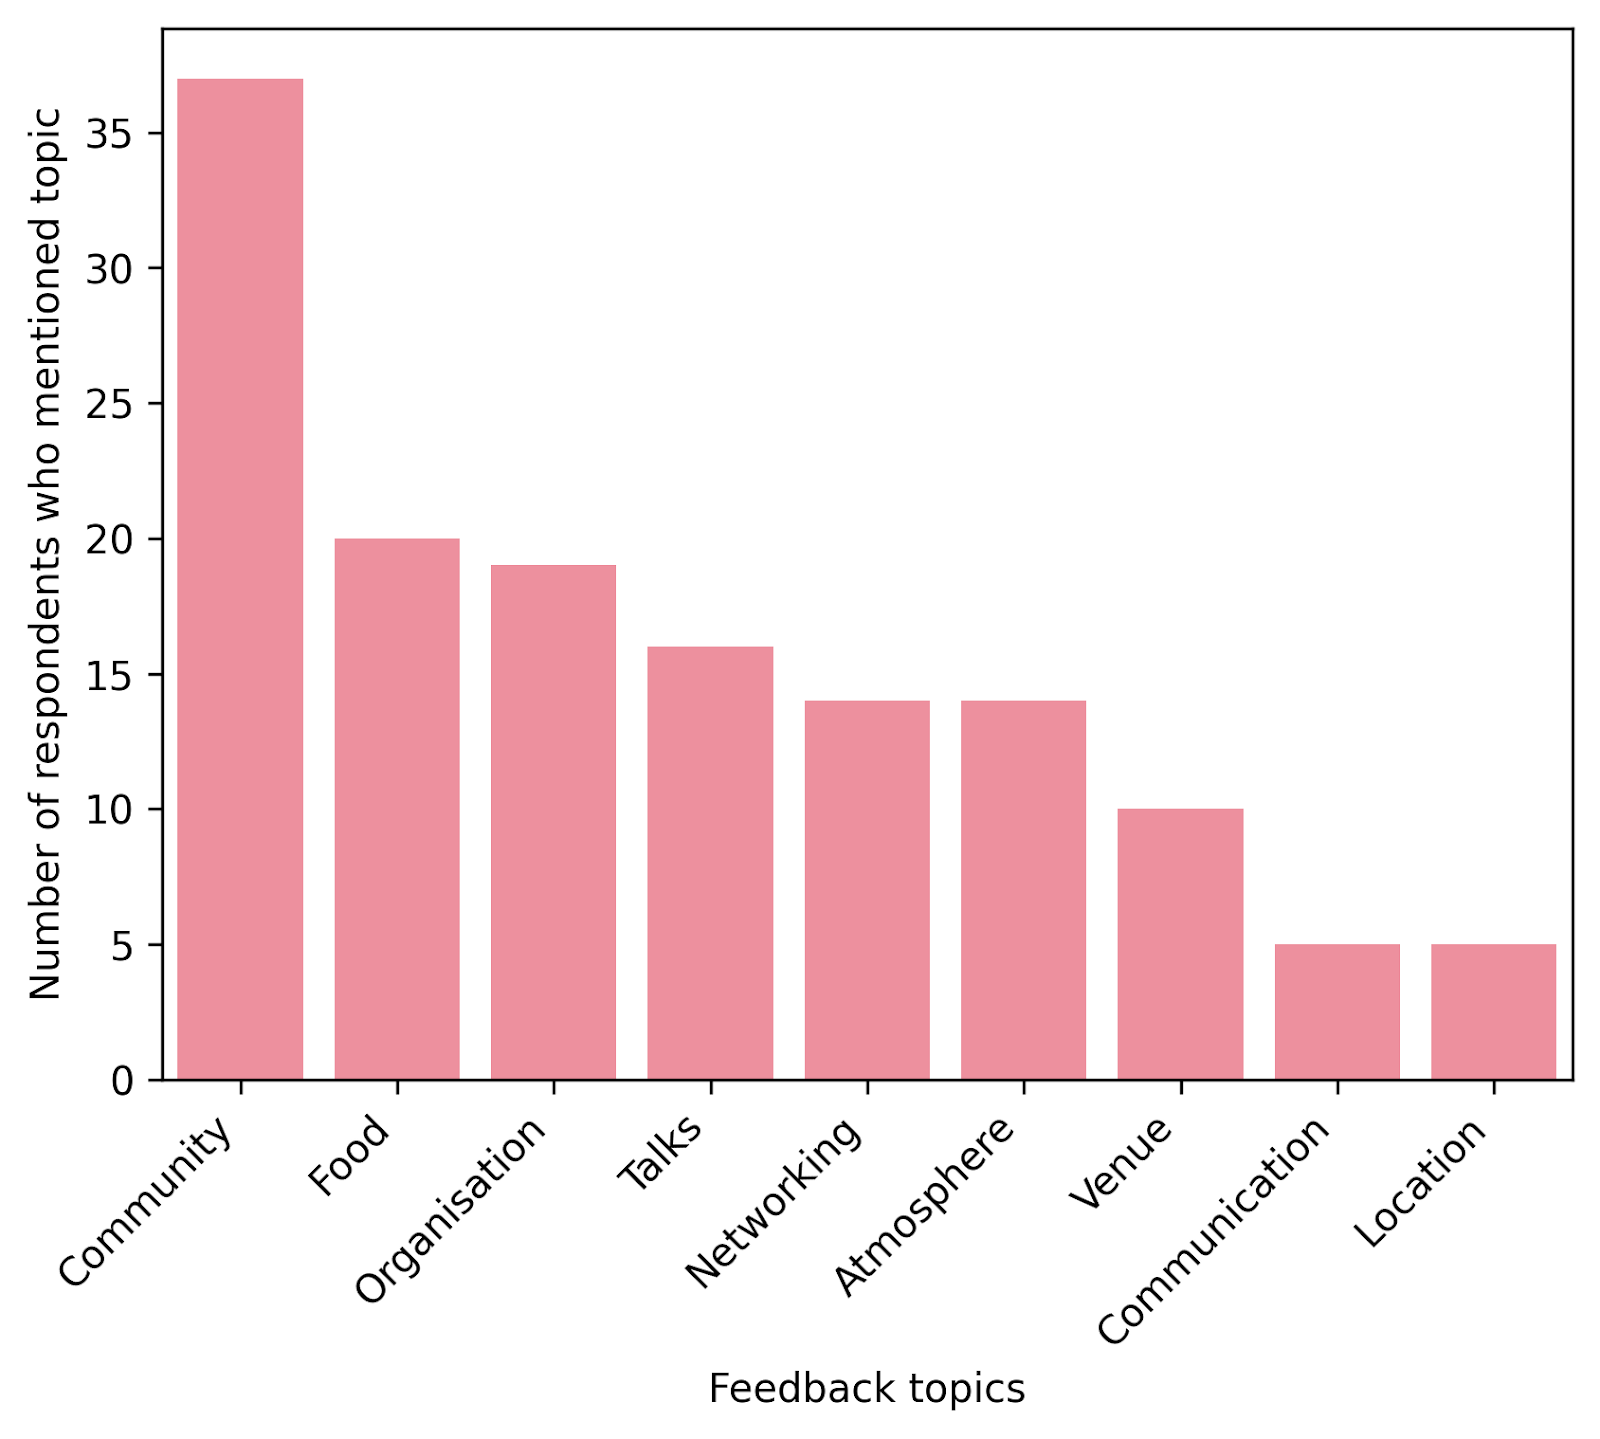
You can see that by far and away the thing that people liked most about EuroPython was community! This is such a core part of Python conferences, and as we worked hard on this aspect of EuroPython, we're thrilled this was valued so much by the attendees.
Rounding out the top five, people also enjoyed the food, organisation, talks and networking.
With a general overview of the feedback on EuroPython 2024 in mind, let's jump into specific aspects of the conference such as the food, talks, workshops, and more.
Food & Catering
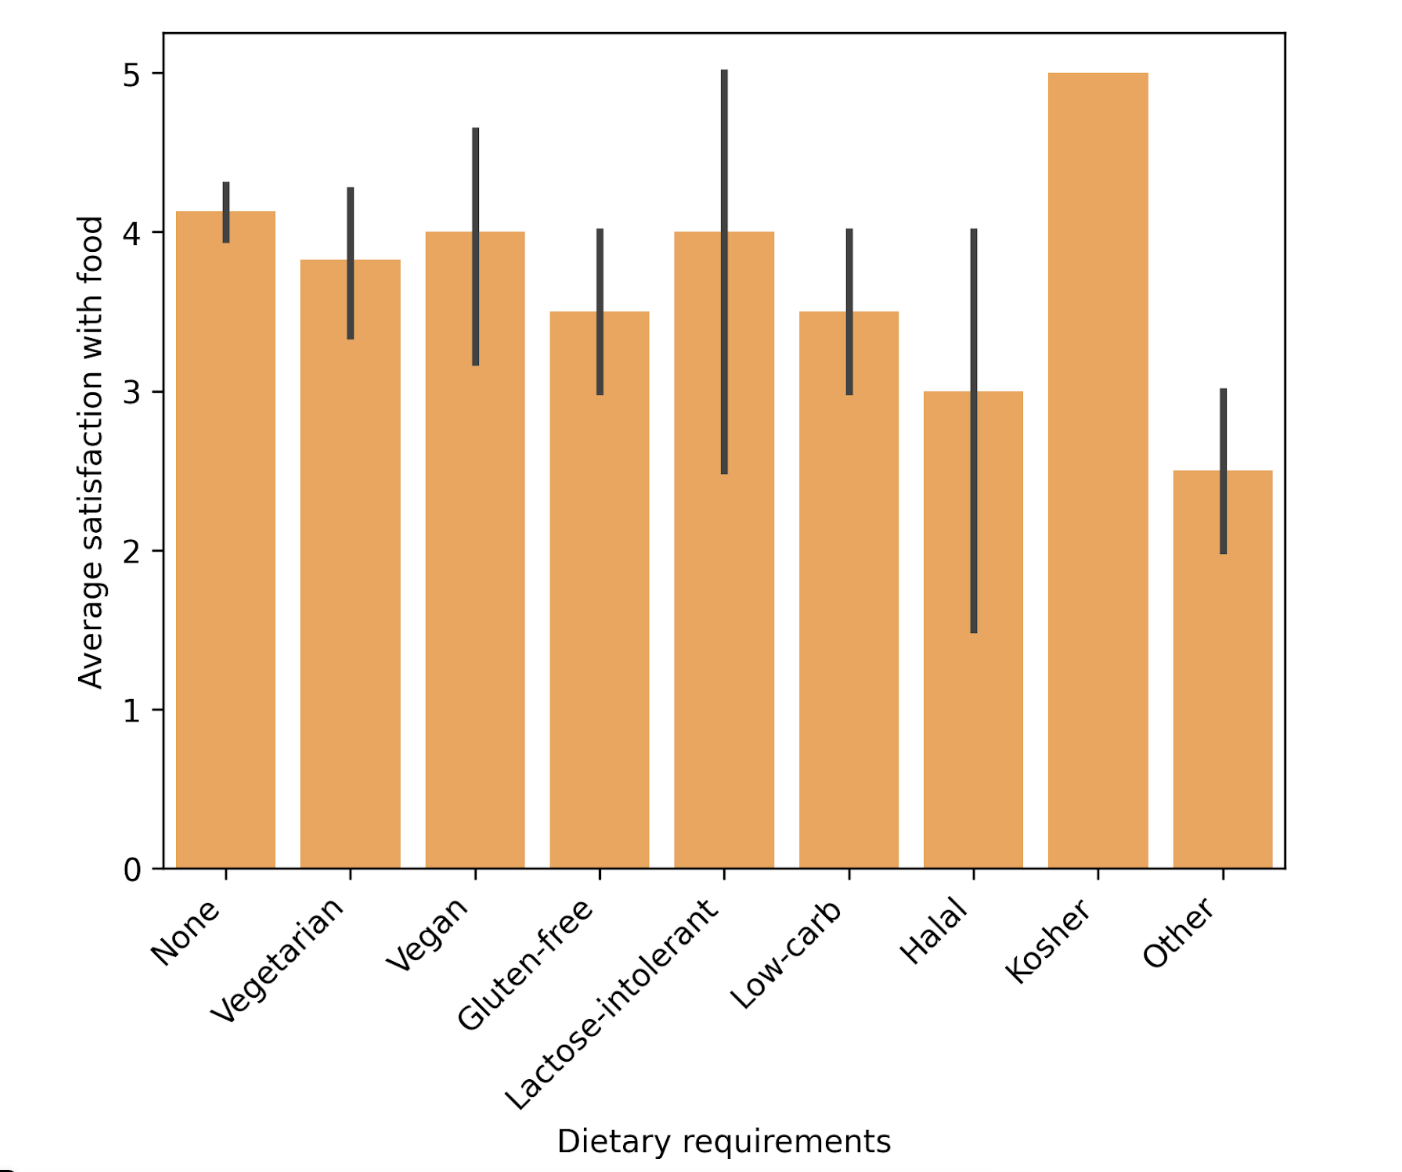
As noted above in the first graph, people were overall satisfied with the food. When breaking this down by dietary requirements, satisfaction varied a bit more.
Note: we have very small samples for some of these special dietary groups.
PyLadies workshops
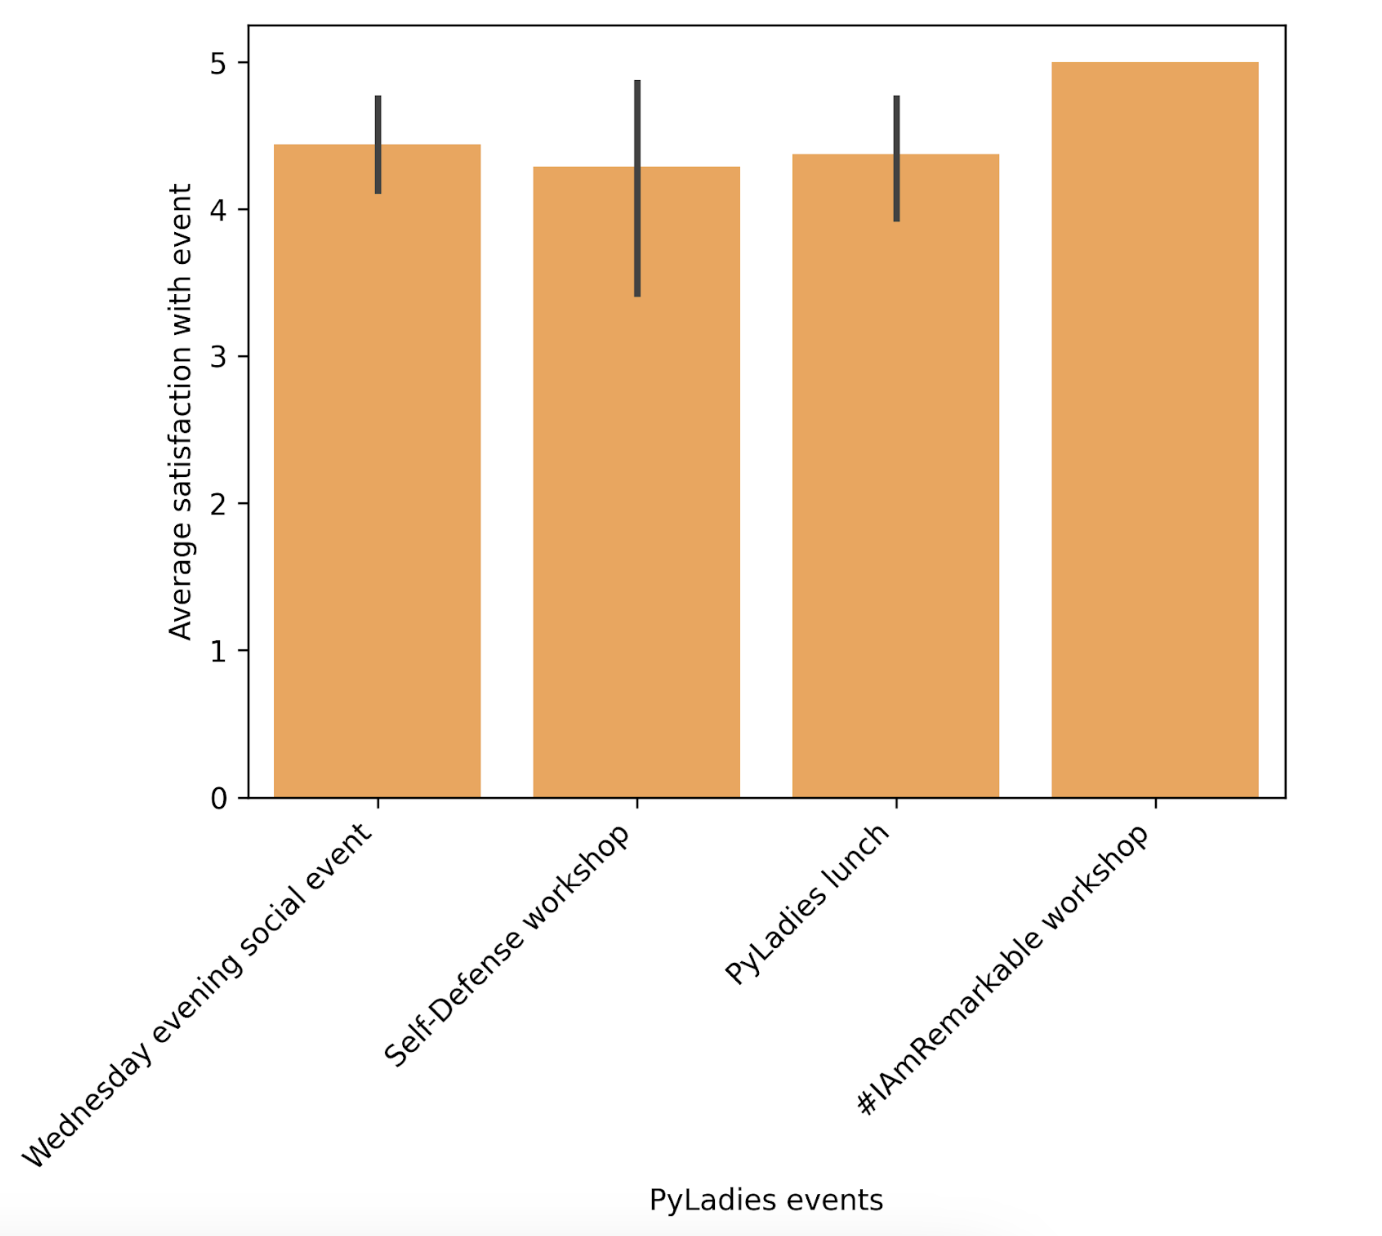
Only 28 respondents indicated that they had attended at least one PyLadies workshop, so we should interpret the below findings with caution. However, on average, attendees were very satisfied with the PyLadies events (M = 4.4).
Below is the breakdown of mean satisfaction per PyLadies event (some people attended multiple events, hence the total exceeds 28).
Community tutorials
Only 8 respondents indicated that they had attended at least one of the community tutorials so unfortunately this means we cannot break down the data by tutorial. However, again the overall mean satisfaction rating was high (4.0).
Talks
In another free text question, we asked attendees to let us know which talks they particularly liked and those they didn't enjoy as much. One hundred and four attendees gave us feedback on the talks they liked, and 59 gave feedback on talks they did not like, with most people mentioning multiple talks. This gave us a nice dataset to analyse, allowing us to cut it by several facets.
We normalised the free text feedback by matching it up to the closest title by converting all of the titles to document embeddings, and then checking this manually. The findings are broken down below by talk level, type and track.
Level
Attendees seemed to enjoy talks across all levels equally, with around 4 times more people liking versus disliking talks at each level.
Type
By far the most popular type of talk were long talk sessions. These talks received a lot of feedback, with 15 times more attendees saying they liked these talks versus disliking them. The keynotes were also well received, with 4 times more people mentioning liking them versus disliking them.
Posters were only mentioned once in the feedback. While it is hard to say from this feedback as it does not measure attendance, it is possible that an issue is that not as many people went to see the posters as talks.
Track
While it is hard to draw robust conclusions for this category as there are very small samples in most of the tracks, some particularly popular tracks (with a high ratio of likes to dislikes and high number of overall likes) are:
- Arts, Crafts, Culture & Demos
- Testing and QA
- Career, Life, Health
- Python Libraries and Tooling
- Python Internals & Ecosystem
Special thank you to our amazing data wizard Jodie Burchell for putting together together this report!
If you have any questions, you are welcome to reach out to the team at helpdesk@europython.eu